Definition
You're probably aware of what an average is, but let's define a simple one just to get on the same page. The average of several numbers is their sum divided by how many there are.
For example, the average of the first five digits 1, 2, 3, 4, 5, is
$$\frac{(1 + 2 + 3 + 4 + 5)}{5} = \frac{15}{5} = 3$$
Not surprisingly, this is just the middle digit, but it isn't always that way. For example, the average of the set {1, 2, 3, 3, 6} is
$$\frac{1 + 2 + 3 + 4 + 5 + 6}{6} = \frac{21}{6} = 3.5,$$
which is not even in the original list.
We can formalize the definition of an average using summation notation. We'll begin the habit of denoting averages of some quantity $x$, with a bar over the variable: $\bar{x}$
$$ \begin{align} \bar{x} &= \frac{1}{n} \sum_{i=1}^n x \\[5pt] &= \frac{x_1 + x_2 + \dots + x_n}{n} \end{align}$$
← Add up all n of the x values and divide by n.
A simple average like this is also called a mean or mean value or sometimes an arithmetic mean of a set of numbers.
There are several other kinds of averages, useful in certain special situations. We'll cover most of them below. The trick will be not to memorize the different kinds, but to understand which are used in what circumstances, and why.
Why do we average?
So why do we want to average numbers? The answer is usually noise. The world is full of noise. It's unavoidable.
I don't mean noise in the sense of loud sounds in your ears (though it could be that). I mean random fluctuations in any measurement we every try to take.
Imagine that a bunch of us measure a brick, say to the nearest millimeter (about the width of one of the m's in "millimeter."
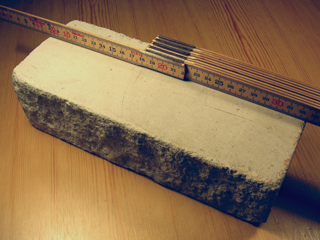
Source: Wikipedia Commons, Holger.Ellgard
Now a brick can have uneven edges, and there's no guarantee that we'll all read the ruler exactly the same way, down to the nearest mm. We might expect to mostly get the same number, but within a spread of 1 or 2 mm.
Even if we all practice our measuring so that it's more consistent, we'd still have some variation in our measurements, but maybe just on some finer level, like the nearest half or quarter millimeter.
That's what I mean by "noise." Those kinds of fluctuations are always present at some level of detail.
So let's look at some hypothetical numbers from our brick measurement:
Measurements in mm
| Trial | Length | Trial | Length |
|---|---|---|---|
| 1 | 340 | 8 | 343 |
| 2 | 342 | 9 | 344 |
| 3 | 340 | 10 | 440 |
| 4 | 341 | 11 | 344 |
| 5 | 343 | 12 | 343 |
| 6 | 342 | 13 | 342 |
| 7 | 341 | 14 | 340 |
If we want to report the length of the brick, which number do we pick? (Oh, I'm a poet and I don't even realize it!) Whose do we trust the most. Usually the best answer is to average all of the results.
The average (after rounding to three digits like our measurements) is 349 mm. But wait ... that's way bigger than most of our measurements. What gives?
Look at measurement #10. It's 100mm longer than any of the other measurements. It's probably save to conclude that something went terribly wrong here. We call this kind of measurement an outlier, and as long as we can justify it, it's usually OK to toss it out of our average calculation. In that case, averaging the remaining 13 lengths gives us 342mm, and that seems about right.
Averaging and accepting the result as as close as we're likely to get to the "true" length of the brick means that all of our measurements (except the outlier) contribute equally to our final result, and that feels better to most people.
Types of averages (there's more than one)
Here we'll go over some of the more important types of averages and the reasons for using them. We already covered the arithmetic average or arithmetic mean above, by far the most commonly used kind of average.
Sometimes data comes to us non-stop, with a new data point added to a continuous stream at regular time intervals — seconds, minutes, days, years, and so on. More often than not, that data has a lot of fluctuations (noise) that can mask more important trends.
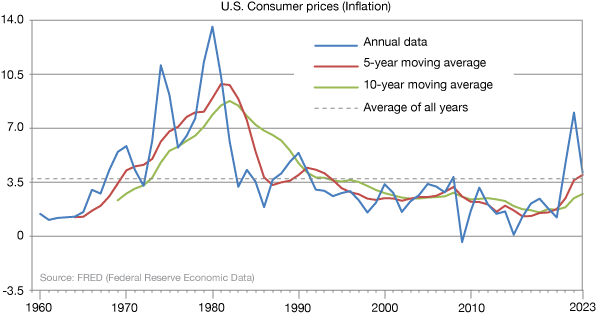
The graphs below come from The U.S. Federal Reserve Economic Database (FRED). It shows the yearly variation of a key measure of inflation of prices for consumers.
The red curve is calculated by "waiting" through the first five years, then averaging the those five years and plotting a point. Each successive point is the average of the current year and the four preceding years. Notice how a lot of the flucutations have eased — the red curve is much smoother.
The green curve is a ten-day moving average, and it is smoother still. How many data points to use in a moving average is up to you, but beware:
Pro tip:
There is a diminishing return. It turns out that you don't double the smoothness of the curve if you average twice the number of points. It actually goes as the square root of the increase in points averaged. So averaging twice as many points will get you the square root of 2 (= 1.414) times the smoothness. We'll see why that is in later sections. And of course if we average too many points, we just wash away all of the bumps altogether — we lose information.
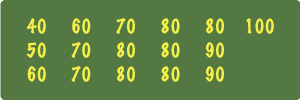
The simplest way to think about weighted averages is to consider a list of numbers in which some repeat. Let's think about some test scores from a class. I'll keep it simple and just use increments of 10. The scores of 16 students might look like this:
Now the average is pretty easy, just add up all 16 scores and divide the result by 16:
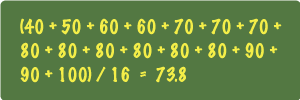
But if you're clever, you've notice that that's the long way. Notice that the scores 60, 70, 80 and 90 repeat. Wouldn't it be much easier to calculate the average this way:
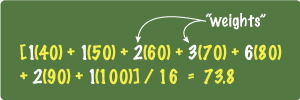
We call the (white) numbers 1, 1, 2, 3, 6 and 2, the "weights" in our average. While the scores 40 and 50 carry weights of 1 each, 80 has a weight of 6 in our calculation because it shows up six times as often. A score of 60 has a weight of 2, and so on.
At first the term "weight" can be confounding. Think of it as an indication of the importance of that number. A score of 80 in this data is 6 times as important as a score of 40 because it shows up 6 times more.
What weighted averages are used for — an example from chemistry
A simple example of how weighted averages are used is the atomic weights listed in the periodic table. Did you ever wonder why they're not just multiples of the weight of hydrogen (H)? Where do those fractions of a mass unit come from?
Take chlorine (Cl) for example. The atomic weight listed in the periodic table is 35.459 grams per mole (I'm going to leave off the units from here on). That means if you took a mole (6.022 x 10²³ atoms) of Cl and weighed the pile, you'd get 35.459 grams — if you had a precise enough scale.

But that pile of chlorine will consist of two kinds of isotopes of Cl. You see, chlorine on Earth comes mainly in two forms, 35Cl and 37Cl, the latter having two "extra" neutrons.
More precisely, on Earth (it's different in different parts of the universe) we find that 75.77% of the Cl is 35Cl, with an atomic weight of 34.969, and 24.23% of it is 37Cl, with a weight of 36.966.
Because any batch of chlorine we put together on Earth will have this same ratio of isotopes, we need an averaged atomic weight that reflects such a mixture.
Here's how we do it. First, find the weights and their relative abundances:
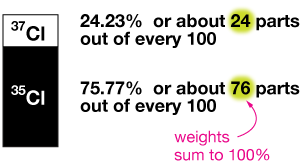
Now calculate the weighted average:
$$ \begin{align} \bar{w} &= \frac{\color{#E90F89}{24}(36.996) + \color{#E90F89}{76}(34.969)}{100} \\[5pt] \bar{w} &= 35.453, \end{align}$$
where the
Note: To get the answer I did, you'll have to use weights of 24.23 and 75.77.
Practice problem
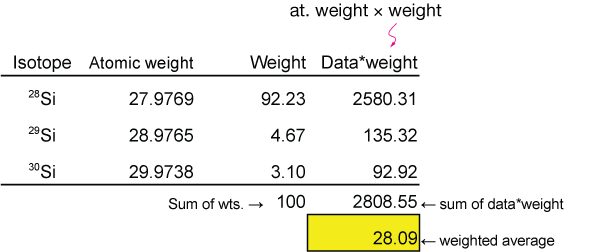
Calculate the weighted average atomic weight of Silicon (Si). On Earth, Si exists as
| isotope | weight (g/mol) | abundance (%) |
|---|---|---|
| 28Si | 27.9769 | 92.23% |
| 29Si | 28.9765 | 4.67% |
| 30Si | 29.9738 | 3.1% |
Solution
The geometric mean is often used to come up with a single "figure of merit" for something that might be described by two or more sets of very different numbers.
For example, let's say that we want to rate movies based on the ratings of several movie critics. The trouble is that our critics might use different rating scales. Let's say there are four critics and they use 5, 10, 20 and 100-point scales, respectively.
Let's say our movie got ratings of
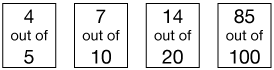
If we were to average those ratings using an arithmetic mean we'd get
$$\bar{x} = \frac{4 + 7 + 14 + 85}{100} = 1.10$$
Now that number isn't very meaningful. Let's express it as a percent of the total number of points possible, 135. We get 81.4%.
The trouble with this kind of average is that it gives much more weight to the larger numbers. The 85/100 score exerts more influence than the other ratings, and we'd really like them all to have about the same influence on the overall rating.
A better way to compare the critics' scores is to multiply all four together and take the fourth root of the result:
$$\bar{x} = \sqrt[4]{(4)(7)(14)(85)} = 13.5$$
Had our film garnered all possible points from all reviewers, the geometric mean would have been:
$$\bar{x} = \sqrt[4]{(5)(10)(20)(100)} = 17.8$$
Our geometric mean score is now 76% of the total possible score, and that feels about right.
The closer our data points are to one another, the closer the geometric mean will be to the arithmetic mean. Here is an example for four close data points:
$$ \begin{align} &\color{#E90F89}{\text{data}}\\[5pt] &50, \, 55, \, 48, \, 46, \, 51 \\[5pt] &\color{#E90F89}{\text{geometric mean}}\\[5pt] &\bar{x} = \sqrt[5]{(50)(55)(48)(46)(51)} = 49.9 \\[5pt] &\color{#E90F89}{\text{arithmetic mean}}\\[5pt] &\bar{x} = \frac{50 + 55+ 48 + 46 + 51}{5} = 50.0 \end{align}$$
A general formula for the geometric mean is:
$$\bar{x} = \left( \prod_{i=1}^n x_i \right)^{\frac{1}{n}}$$
The giant π here is like the Σ in a summation, except that it means to multiply the xi rather than add them.
Often, we'd like to ask a question like, what is the average deviation of a function from some value? For example, what is the average displacement of a sine function from y = 0?
It's kind of like asking, "if you were walking along a sine function (like the one in the graph below), on average, how far would you be from the center line after having walked for a few cycles." For most of your walk, you'd be off the line, only crossing it twice in each cycle.
As a model for this situation, the graph shows two cycles of a sine wave with points spaced evenly along it. If we simply average the y-values of these points, we get zero, because the sum is zero (yellow box).
But that's surely not our average distance from the center line. It could only really be zero if we walked right on the line y = 0.
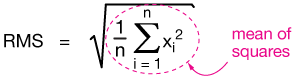
We need a way to get around the problem of negative data points canceling positive points: We use the root mean square average.

It works like this: We take each point, square it (now everything is positive) and sum the squares. We then take the square root of the sum and divide by the number of points. It looks like this:
Now let's do the calculation for the dataset in the figure above:
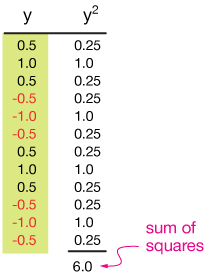
Now divide by the number of points to get the mean of the squares, and take the square root.
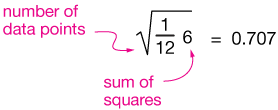
Now that makes more sense. It says that on average, the sine curve is about 0.707 units away from the x-axis if we average enough cycles.
The RMS is used very often in measurements of voltage in electric circuits that use alternating current (AC). In such circuits, the voltage is very real (maybe even dangerous), and it wouldn't do to mistake it for zero.
Practice problems
Find the averages as directed. You might find it easier to use a spreadsheet program or a calculator.
-
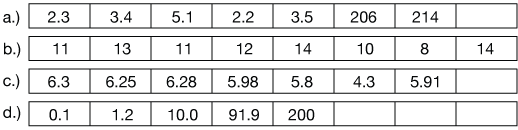
Calculate the arithmetic and geometric means of the following sets of numbers. For which might the geometric mean be more appropriate, and why?
Solution
a.) Arithmetic:
x = 62.4 Geometric:x = 10.4
For this data, the two points near 200 skew the arithmetic mean far from the five other points, therefore the geometric mean might be more appropriate. It depends on the circumstances, the type of data and its meaning.b.) Arithmetic:
x = 11.6 Geometric:x = 11.4
For this data, the geometric and arithmetic means are nearly the same. Either is OK, but we would usually then default to the arithmetic mean, the more common analysis.c.) Arithmetic:
x = 5.8 Geometric:x = 5.8
Because both means are identical, either will work, though in such cases, we usually opt for the arithmetic mean.d.) Arithmetic:
x = 60.6 Geometric:x = 7.9
This is a tough one. Each data point differs in value by an order of magnitude (×10) from the next. Which mean is more appropriate (if any is) will be situation dependent.
-
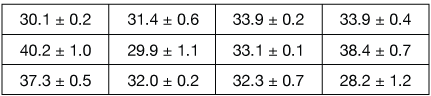
The weights of data in a weighted average can sometimes be taken from the uncertainties of the measurements, if they're available. Often, we assume a weight proportional to the reciprocal of the uncertainty. For example, a data point written like 2.1 ± 0.2 has an uncertainty of plus or minus 0.2. We might give it a weight of 1/0.2 = 5 in a weighted average. In this way, numbers with small uncertainties will receive larger weights, denoting our greater confidence in them. Find the weighted average of these data:
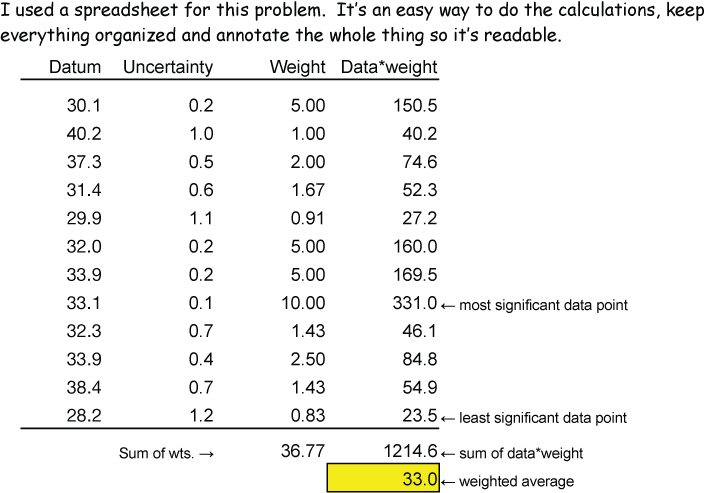
Solution
-
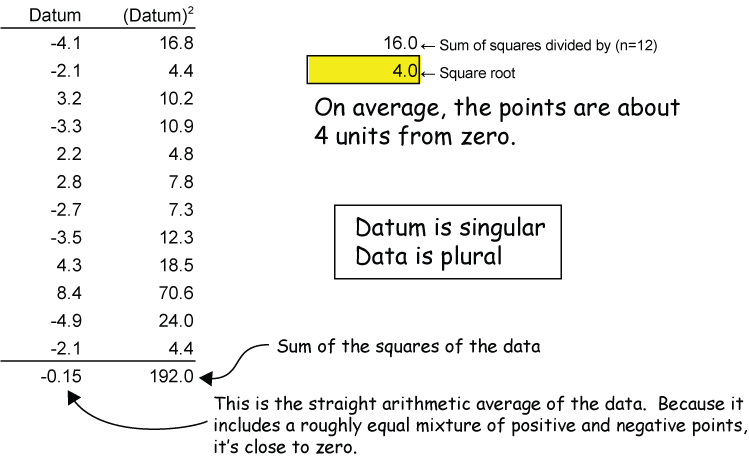
Calculate the RMS average of these data:
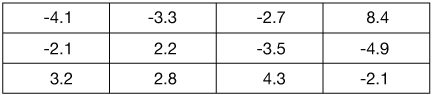
Solution

![]()
xaktly.com by Dr. Jeff Cruzan is licensed under a Creative Commons Attribution-NonCommercial-ShareAlike 3.0 Unported License. © 2012-2025, Jeff Cruzan. All text and images on this website not specifically attributed to another source were created by me and I reserve all rights as to their use. Any opinions expressed on this website are entirely mine, and do not necessarily reflect the views of any of my employers. Please feel free to send any questions or comments to jeff.cruzan@verizon.net.