Coordinate systems: What are they good for?
By now you're used to the Cartesian coordinate system, the x-y grid that we generally use to graph functions and plot points. Each point has a set of coordinates (x, y), a recipe for finding the point starting from the origin.
Aside from its convenience—axes at 90˚ angles, evenly-spaced grid points—there's nothing unique about the Cartesian plane. In fact, there are an infinite number of different coordinate systems, mostly silly ones, that we could use. Though less convenient, any of them will work to represent any mathematical problem or function in a plane.
For example, if you're reading this section, you've probably dealt with balls rolling down ramps in physics. Recall that in those problems you redefined your coordinate system. You tilted it to make the x-axis parallel to the ramp and the y-axis perpendicular or normal to the ramp.
This helped you to resolve vectors into x- and y-components, and made the problem much easier to deal with.
But the fact is, nature couldn't care less about your coordinate system. Whatever system you choose, the ball will still roll down the ramp just the same.

Examples of coordinate systems
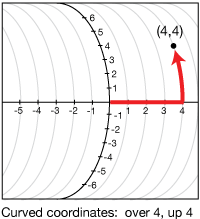
Drawn below are a Cartesian grid (left) and a couple of goofy coordinate systems no one uses, but they can locate a point just the same. The same point on each square is represented with an ordered pair of coordinates in each system.


Polar coordinates
Polar coordinates, defined below, come in handy when we're describing things that are centrosymmetric (have a center of symmetry, like a circle) or that rotate in a circle, like a wheel or a spinning molecule.
In the Cartesian coordinate system, we move over (left-right) x units, and y units in the up-down direction to find our point.
In the polar system, think of a clock with one hand. We move out a distance r, sometimes called the modulus, along the hand from the origin, then rotate the hand upward (counterclockwise) by an angle θ to reach the point.
Pro tip
In mathematics, counter-clockwise ( ↺ ) rotation is considered to be rotation in the positive sense. Clockwise rotation is considered to be a negative rotation.
Polar coordinates: Definitions


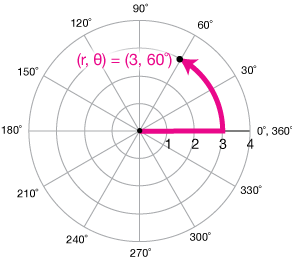
Here is an example of a polar graph →
The point (r, θ) = (3, 60˚) is plotted by moving a distance 3 to the right along the zero-degree line, then rotating that line segment by 60˚ counterclockwise to reach the point.
Any point on a plane can be located in this manner, just like with Cartesian (x, y) coordinates.
The point in the center is usually called the "pole."
![]()
| $$x = r cos(\theta)$$ | $$y = r sin(\theta)$$ |
| $$r^2 = x^2 + y^2$$ | $$\theta = tan^{-1} \left( \frac{y}{x} \right)$$ |
Polar ↔ Cartesian conversion
Converting between polar and Cartesian coordinates is really pretty simple. We just use a little trigonometry and the Pythagorean theorem.
x and y are related to the polar angle θ through the sine and cosine functions (box).
The radius, r, is just the hypotenuse of a right triangle, so $r^2 = x^2 + y^2.$
And because $tan(\theta) = y/x,$ we relate θ to x and y using the inverse tangent function.
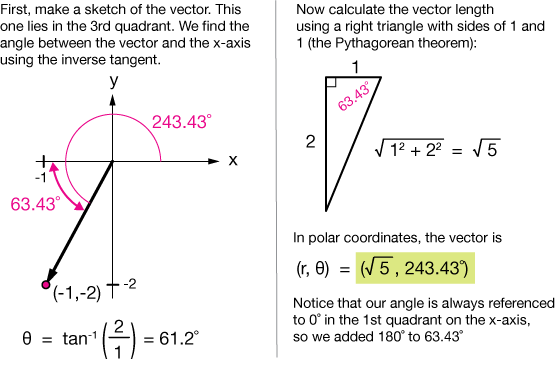
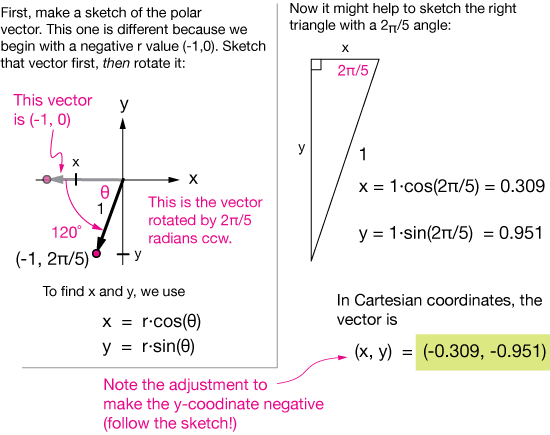
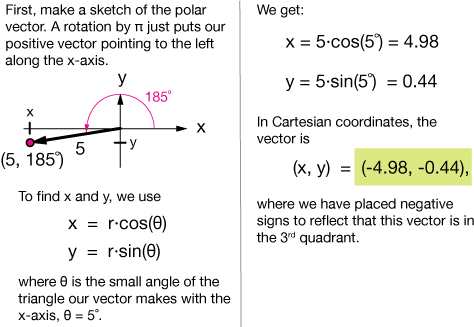
When calculating θ using the inverse tangent function, remember that the range of tan-1 is restricted to $\left[\frac{-\pi}{2}, \; \frac{\pi}{2}\right],$ the first and 4th quadrants, so you'll have to add or subtract 90˚ to get the correct angles in the 2nd and 3rd quadrants. I'll do some examples showing this below.
Practice problems
A. Convert the following cartesian coordinates (x, y) to polar coordinates (r, θ):
| 1. | ||
| 2. | ||
| 3. | ||
| 4. |
| 5. | ||
| 6. | ||
| 7. | ||
| 8. |
B. Convert the following polar coordinates (r, θ) to cartesian coordinates (x, y). Angles not specifically given in degrees are in radians.
| 9. | ||
| 10. | ||
| 11. | ||
| 12. |
| 13. | ||
| 14. | ||
| 15. | ||
| 16. |
Problem 1 solution

Problem 2 solution

Problem 3 solution

Problem 4 solution
Problem 5 solution

Problem 6 solution
Problem 7 solution
Problem 8 solution

Problem 9 solution

Problem 10 solution

Problem 11 solution

Problem 12 solution

Problem 13 solution
Problem 14 solution

Problem 15 solution

Problem 16 solution
Functions in polar coordinates
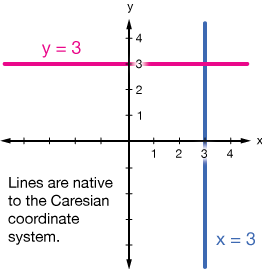
We can express all kinds of functions in polar coordinates, but some are more suitable for them than others. For example, the vertical and horizontal lines in the first graph below are what we could call "native" to the rectilinear (made up of lines and 90˚ angles) Cartesian coordinate system. That's why their equations are so simple. The equation of a circle of radius R, centered at the origin, however, is $x^2 + y^2 = R^2$ in Cartesian coordinates, but just $r = R$ in polar coordinates. The circle is a native figure in polar coordinates.

Example 1
Convert the Cartesian equation $2x - 3y = 7$ to polar form
To convert this function to polar coordinates, we begin with the conversions x = r·cos(θ) and y = r·sin(θ):

Plugging those into our linear equation gives:
$$2r cos(\theta) - 3r sin(\theta) = 7$$
Now we solve for r to get r as a function of θ:
$$r [ 2 cos(\theta) - 3 sin(\theta)] = 7$$
... and that's our line in polar coordinates:
$$r = \frac{7}{2 cos(\theta) - 3 sin(\theta)}$$
Notice that the equation for this line is more complicated in polar coordinates. Lines aren't the natural thing to plot in polar coordinates.
Example 2
Convert the Cartesian circle $x^2 + y^2 = 16$ to polar form
To convert this function to polar coordinates, we begin with the squares of the conversions x = r·cos(θ) and y = r·sin(θ)$x = r cos(\theta)$ and $ y = r sin(\theta):$
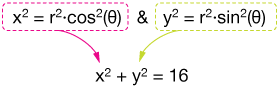
Plugging those into our circle equation gives:
$$r^2 cos^2 (\theta) + r^2 sin^2 (\theta) = 16$$
If we factor out the r2, and use the Pythagorean identity on what remains
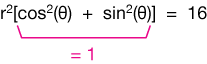
... we have
$$r^2 = 16$$
We can simplify this equation, and we need only take the positive square root, to get
$$r = 4.$$
Notice that this is the simplest possible equation for such a circle. Polar coordinates are great for circles.
Example 3
Now look at a circle not centered at the origin: $(x - 2)^2 + y^2 = 4$
Convert this circle to polar coordinates.
The function is
$$(x - 1)^2 + y^2 = 4$$
The first step is just to substitute $x = r cos(\theta)$ and $y = r sin(\theta)$ for x and y:
$$[r cos(\theta) - 1]^2 + r^2 sin^2(\theta) = 4$$
Now do the squaring, remembering that the binomial-squared has three terms,
$$r^2 cos^2 (\theta) - 2 r cos(\theta) + 1 + r^2 sin^2 (\theta) = 4$$
Gathering terms with r2 gives us a Pythagorean relationship that we can evaluate to 1

The simplified equation is:
$$r^2 = 3 + 2r cos (\theta)$$
which gives us the polar function:
$$r = ± \sqrt{3 + 2r cos(\theta)}$$
Practice problems
Convert these polar functions in the form of r(θ) to Cartesian equations in the form of y(x).
| 17. | $r = 3 sec(\theta)$ | |
| 18. | $r = -2 csc(\theta)$ | |
| 19. | $2 sin(\theta) - 4 cos(\theta) = r$ |
| 20. | $r sec(\theta) = 3$ | |
| 21. | $r = 1 - sin(\theta)$ | |
| 22. | $r = sin(\theta) [cos^2 (\theta)]^{-1}$ |
Convert these Cartesian functions in the form of y(x) to polar coordinates in the form of r(θ). You might want to plot these functions on a calculator to make sure they meet your expectations.
| 23. | $x^2 + y^2 = 19$ | |
| 24. | $-2x + 3y = 5$ | |
| 25. | $(x - 3)^2 + y^2 = 9$ |
| 26. | $y = -3x^2 + 2x - 1$ | |
| 27. | $y = -3x^2$ | |
| 28. | $y = 8x - 7$ |
Polar graphs – some examples
Here are just a few examples of the graphs of functions in polar coordinates. Notice how some functions are much simpler in polar than in Cartesian coordinates. In the exercises above, you might have noticed that some polar functions are very complicated in the Cartesian world.
Trigonometric functions
The graphs of the sine and cosine functions in polar coordinates are shown here. They are simply circles.
The black curve is the sine function, the red $r = cos(\theta).$
What you don't see in these graphs is that as the polar angle, θ, is traced around through 360˚, the sin or cos circle is traced twice. If you plot the polar graph of the function $r(\theta) = sin^2(\theta),$ you'll see a figure-8 shape, the upper loop traced as θ runs from 0˚ to 180˚, and the lower loop as the lower half between 180˚ and 360˚.
The polar graphs of $r = sin^2(\theta)$ and $r = cos^2(\theta)$ are shown below in blue and black, respectively.


Cardioids

These heart shaped (cardioid has the same root as cardiac) figures are the graphs of functions like $1 - cos(\theta)$ and $1 - n\cdot sin(\theta),$ where n is an integer.
Two functions are graphed here, and it's not difficult to see what tweaking the number in front of the sine function does. The analogous cosine function has its "dimple" or loop facing to the right.
These functions are very difficult to represent in Cartesian coordinates, but very simple in polar. Plotted here are $r(\theta) = 1 - cos(\theta)$ (in black) and $r = 1 - 2 cos(\theta)$ (blue).
Flowers
Some functions are quite fanciful in polar coordinates. Flower functions like these are formed by increasing the frequency factor (4 in this case). Just as it increases the number of periods per unit length in a Cartesian graph of a trig. function, it increases the number of loops in the polar graph.
You might want to try to graph some of these polar functions on your calculator:

You can graph polar functions on your TI-84 (or similar) calculator. Put the calculator in polar mode, then enter r(θ) (the variable button will automatically switch to θ), then enter the window values, x, y and the range of θ, and graph. Sometimes a small θ step size will cause your calculator to graph a complicated function very slowly, so be careful with that.

Cartesian coordinates
Cartesian coordinates are the normal 2-dimensional (2D) or 3-dimensional (3D) coordinate systems we most-frequently use. In two dimensions, we draw x- and y-axes at 90˚ angles to each other, and in 3D we add a third axis, usually the z-axis, perpendicular to the x-y plane.
The location or direction of an point or particle can be described using Cartesian coordinates (x, y) in the 2D plane, or (x, y, z) in 3D.
normal
A normal is a line that is perpendicular to a surface or to a tangent plane to that surface at a given point. It is more than a perpendicular line. It is perpendicular to a surface or tangent plane when viewed at any angle.
Centrosymmetric
An object is centrosymmetric if every point can be inverted through the center to form a similar point on the other side. For example, the pair of points A and A' on the hexagon below have inversion symmetry through the center point. So do B and B' on the circle. Both figures are centrosymmetric

Modulus
The modulus of a vector is its length.
In mathematics, modulus is another word for absolute value.

![]()
xaktly.com by Dr. Jeff Cruzan is licensed under a Creative Commons Attribution-NonCommercial-ShareAlike 3.0 Unported License. © 2012, Jeff Cruzan. All text and images on this website not specifically attributed to another source were created by me and I reserve all rights as to their use. Any opinions expressed on this website are entirely mine, and do not necessarily reflect the views of any of my employers. Please feel free to send any questions or comments to jeff.cruzan@verizon.net.